The P-F Curve

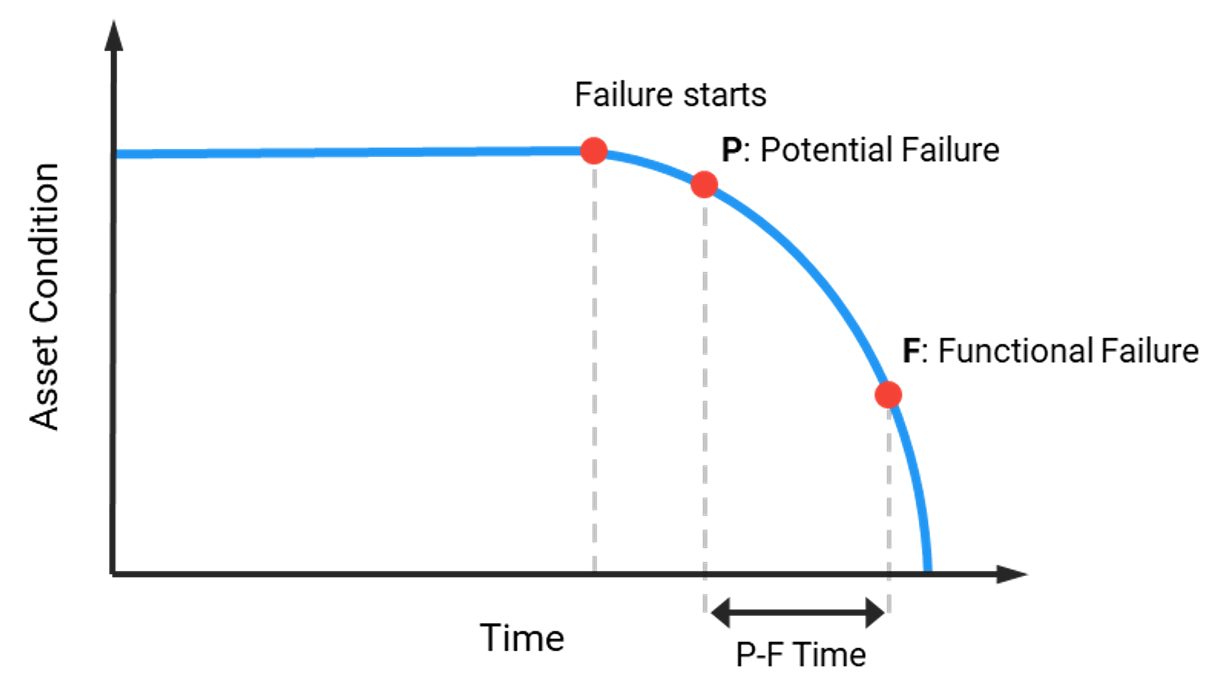
The P-F Curve is a graphical model to visualize the condition of an asset with respect to time. It is useful in explaining the concept of condition-based maintenance and other related concepts.
The P-F Curve represents a relationship between the asset condition and time. It can be seen in the model that at the start of a failure, the asset condition begins to decrease until it reaches the functional failure (F). The general goal of asset inspections in a predictive maintenance plan is to detect condition deterioration before the asset reaches its functional failure.
Analysts apply various predictive technologies to detect noticeable failure symptoms from the P point where failure is detectable.

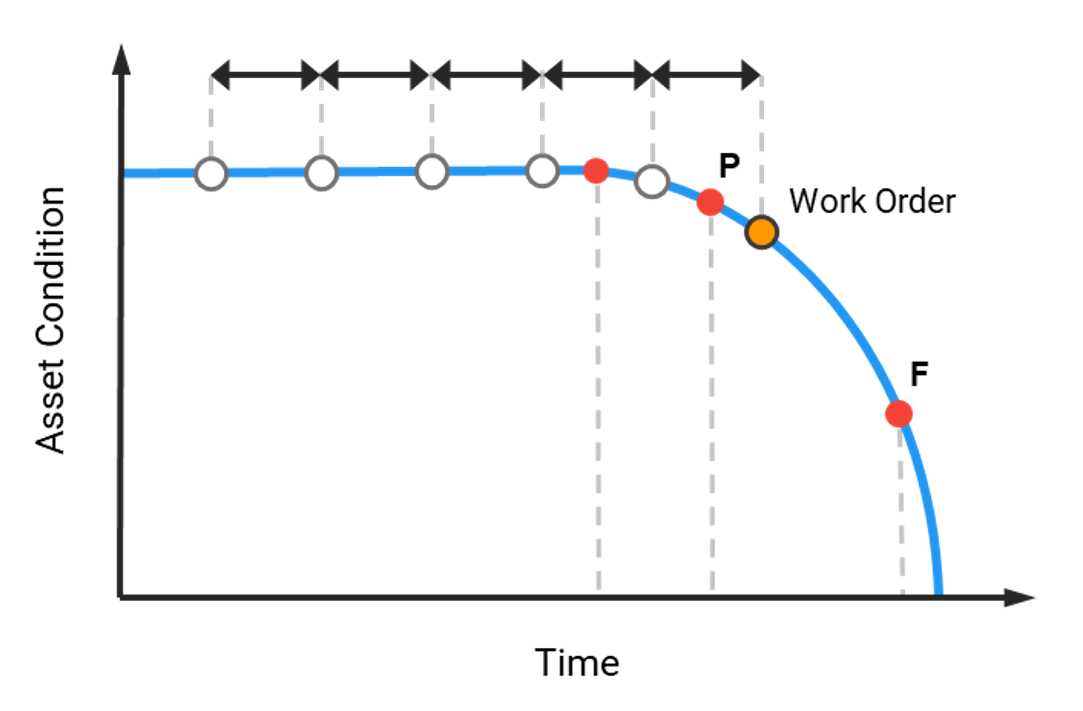
The P-F Curve also helps us understand the importance of the periodicity of asset inspection. The time between inspections must be at least half of the P-F Time. Thus, the graph serves to represent the concept of inspection times.
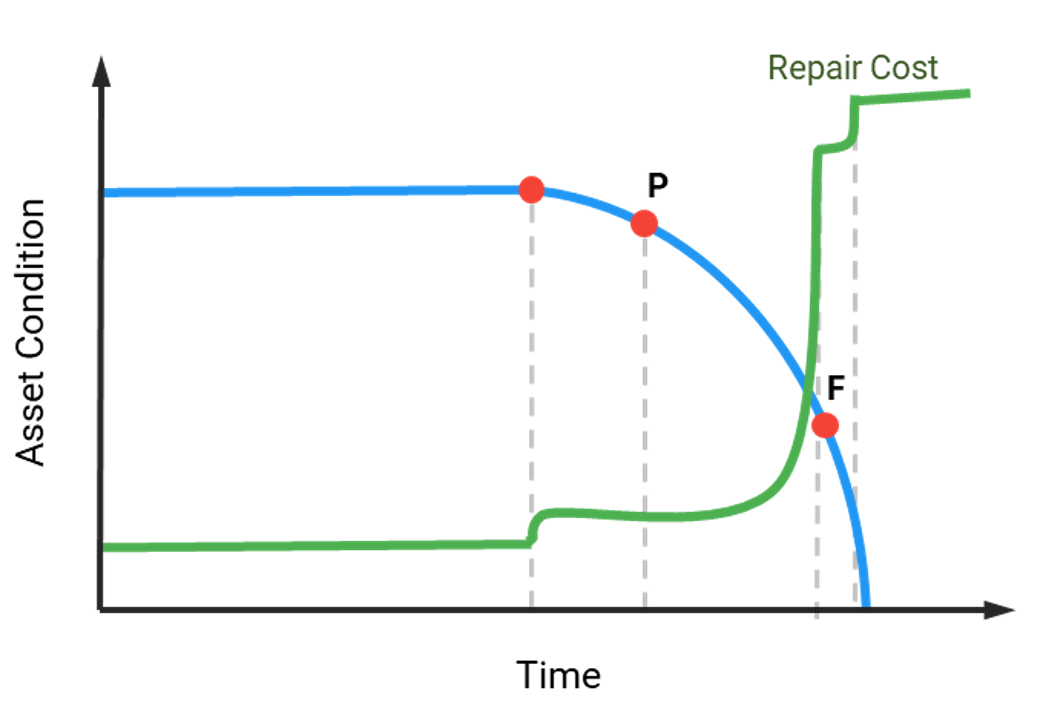
 When an analyst encounters symptoms after point P, it is necessary to issue a work order to perform a corrective maintenance task on the asset and which must be
performed before point F. Otherwise, the repair costs will be severely increased.
In the same P-F Curve, the variations in the repair costs of an asset can be represented schematically as its health deteriorates without corrective action.

Maintenance managers must understand these basic concepts to establish predictive maintenance goals and indicators. From this, an asset inspection plan can be designed based on the analysis of the condition and the possible failures and symptoms that each asset may have.
Power-MI is the software tool that optimally manages predictive maintenance and interfaces with maintenance software (CMMS) for the exchange of work orders.
What is Power-MI?
Power-MI is a cloud based solution that allows you to design & manage your condition-based maintenance plan integrating all techniques into one platform. Easy reporting, automatic work orders and CMMS integration.
Read more